There is an indicator that, according to Warren Buffett, “is probably the best single measure of where valuations stand at any given moment”. The legendary investor was referring to the market value of all publicly traded securities as a percentage of the country’s business (GDP). The stock market capitalization-to-GDP ratio is often referred to as the Buffett indicator. The ratio can be used to determine whether the stocks are overvalued or undervalued. Buffett indicator can be calculated for a single country, a region, or the entire world.
Wilshire 5000 Total Market Index is widely accepted as the definitive benchmark for the U.S. equity market and often used as an indicator of the total US stock market capitalization. We’ve used the index to calculate the Buffett indicator for the United States. Chart 1 illustrates the previous 50 years.
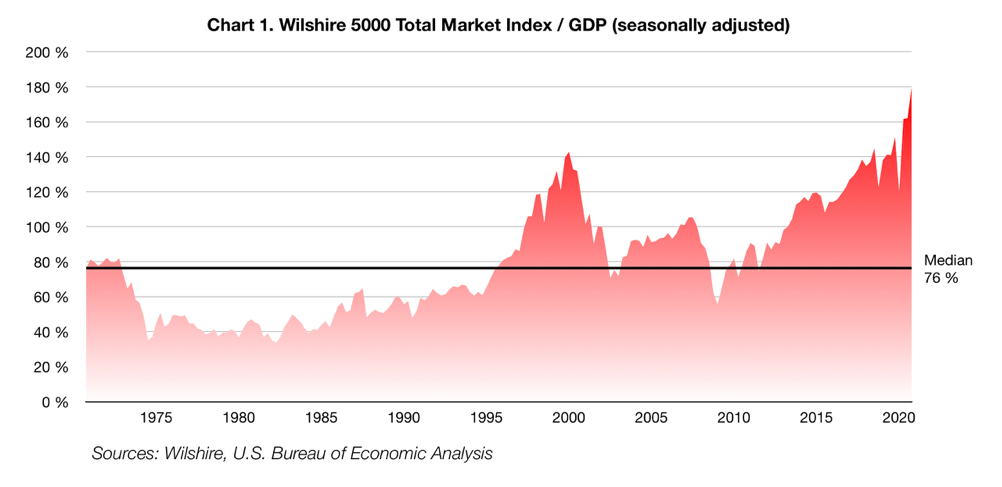
It would be fair to expect that the total market value of all companies would be closely linked to the country’s business volume. Increase of the ratio means the stocks perform better than the economy. The ratio has reached an unprecedented level, which may be considered a very strong warning signal.
Does the indicator say that the market is currently overvalued? Should we be waiting for a massive correction? It is true that US stocks are currently quite expensive despite the COVID-19 crisis. However, we have to bear in mind that the ratio has certain limitations. For example, GDP doesn’t take into account for overseas income of American companies. Moreover, there is one thing that may justify today’s valuations: interest rates. Any change in interest rates adjusts the value of every financial asset. If the interest rate is, say, 5%, the present value of $10,000 which you are going to receive in 10 years from an investment is $6,139. If the interest rate falls to 1%, the present value of the same investment increases to 9,053$. On the other hand, the value of assets declines if the interest rate rises.
The price/earnings ratio of the Wilshire 5000 Total Market Index was 34.2% as of September 30, 2020. We can invert the P/E ratio to get a 2.9% yield, which is above the U.S. 10 Year Treasury note yield (currently 0.9%). In fact, as stated in a Project Syndicate article co-authored by Robert Shiller, a Nobel laureate in economics and professor of economics at Yale University, relative attractiveness of equities compared to bonds is close to its highs across all regions of the world, and stock-market valuations may not be as absurd as it might seem.
However, a never-ending growth in the Buffett indicator cannot be expected. If the trend of the past decade goes on, the stock market may become overvalued, and investors will be playing with fire. Eventually, interest rates may rise, which may affect stocks valuations. The Buffett indicator reminds us that it makes sense to check whether the reality is reflected in the prices of the securities you invest in. A professional advice will help you answer this question.
Risk Warning: The information in this article is presented for general information and shall be treated as a marketing communication only. This analysis is not a recommendation to sell or buy any instrument. Investing in financial instruments involves a high degree of risk and may not be suitable for all investors. Trading in financial instruments can result in both an increase and a decrease in capital. Please refer to our Risk Disclosure available on our web site for further information.